

What your data is telling us about the future of home energy
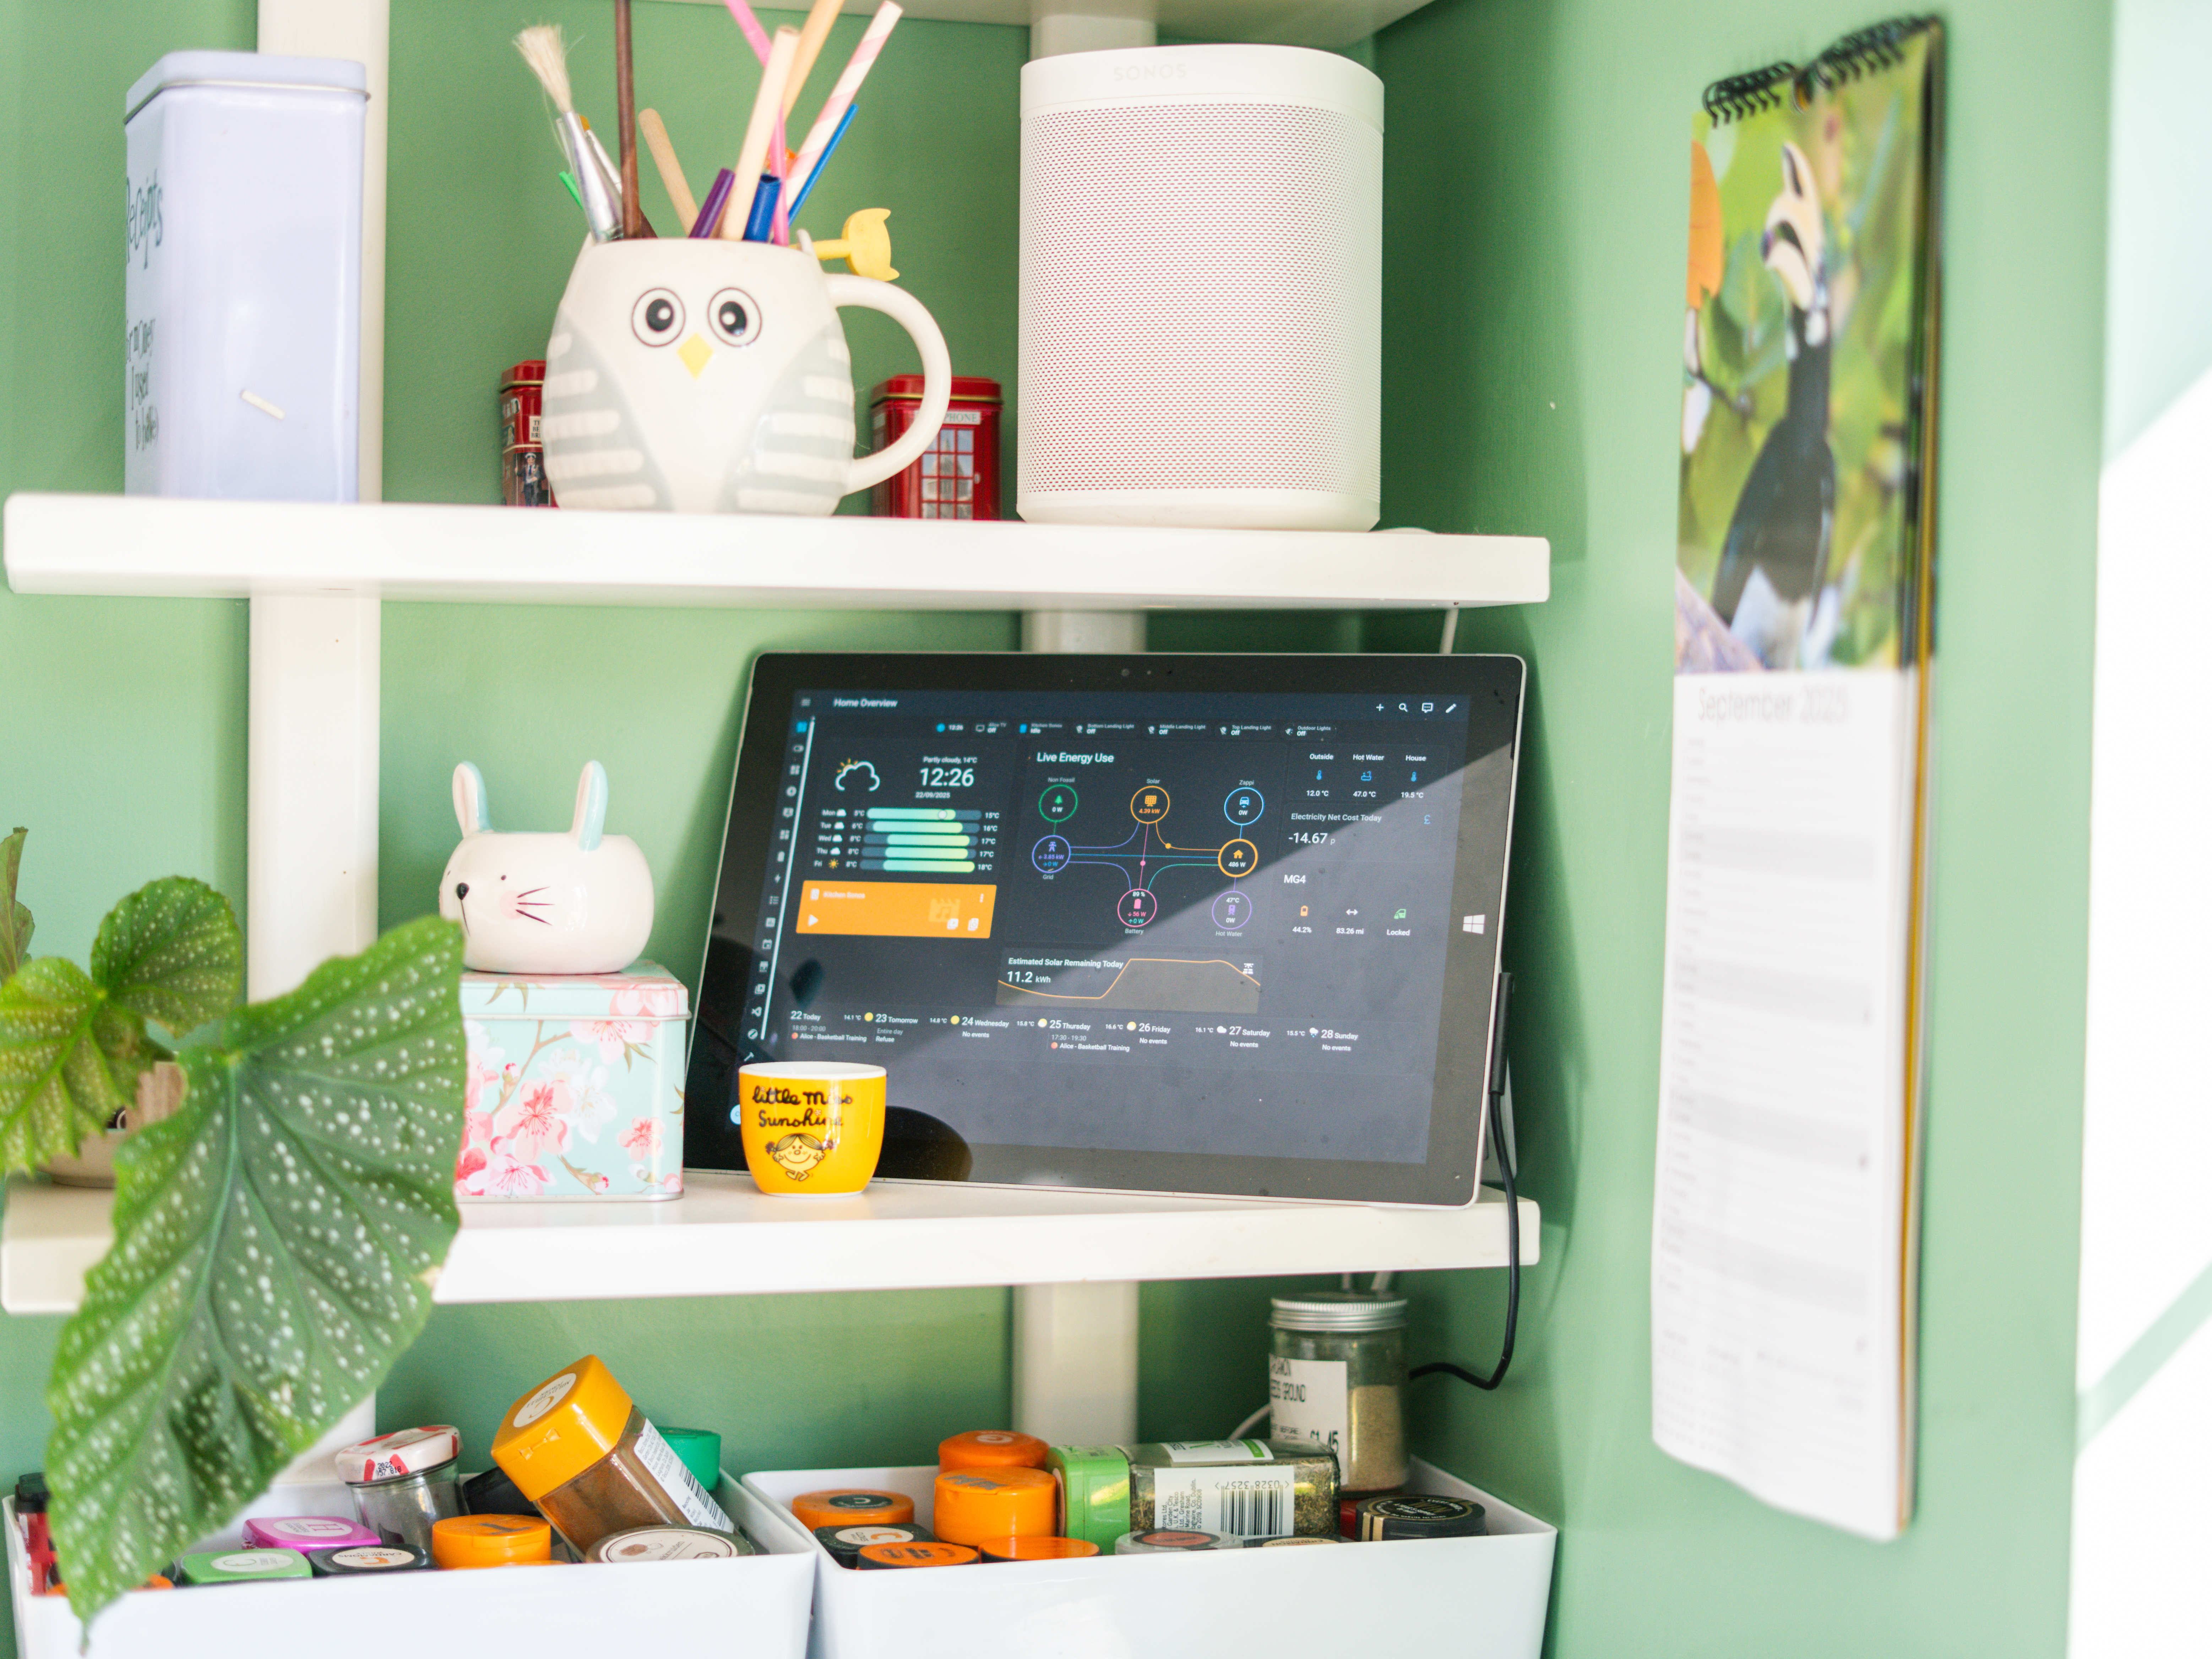
Three insights from across the Living Lab: what they mean for the energy industry, and what they might eventually mean for you.
In Living Lab homes with an electric vehicle (EV), the biggest moment of electricity demand each day isn't during the usual evening peak around teatime. It's around 1am.
That single fact, and what it tells us about how home energy is changing, is one of the things we've spotted recently in data shared by Living Labbers.
The Living Lab is a community of more than 5,000 households across the UK. Many Living Labbers share smart meter data with us, alongside information about their homes and the technologies they use, such as an EV, solar panels, a battery or a heat pump.
We use the patterns we see in the Lab now to help the energy industry understand how the system may need to adapt over the next decade. The more people who share their data with us, the clearer the picture becomes.
Here are three things we’ve learned from your data.
1. A new peak in the middle of the night
Traditionally, household electricity demand dips overnight, rises through the morning, and peaks in the early evening as lots of us get home from work, turn on the lights, cook dinner, and put the kettle on.
But our data shows that EVs are starting to change that pattern.
When we looked at smart meter data from Living Lab homes in November 2024, we saw a large new peak overnight. In our sample, where around half the homes had reported an EV or home charger, the overnight peak was around twice the size of the traditional evening peak. In separate trial groups where every home had an EV, we’ve seen overnight peaks around four times as large.
What's driving this? Cheaper overnight electricity. Some tariffs charge different prices at different times of day, so people can save money by charging their car overnight. In our data, electricity use rises sharply around 12:30am, when the cheaper period for some popular EV tariffs begins. The result is that lots of cars can start charging at around the same time. You can see the effect: a sharp spike at half past midnight.
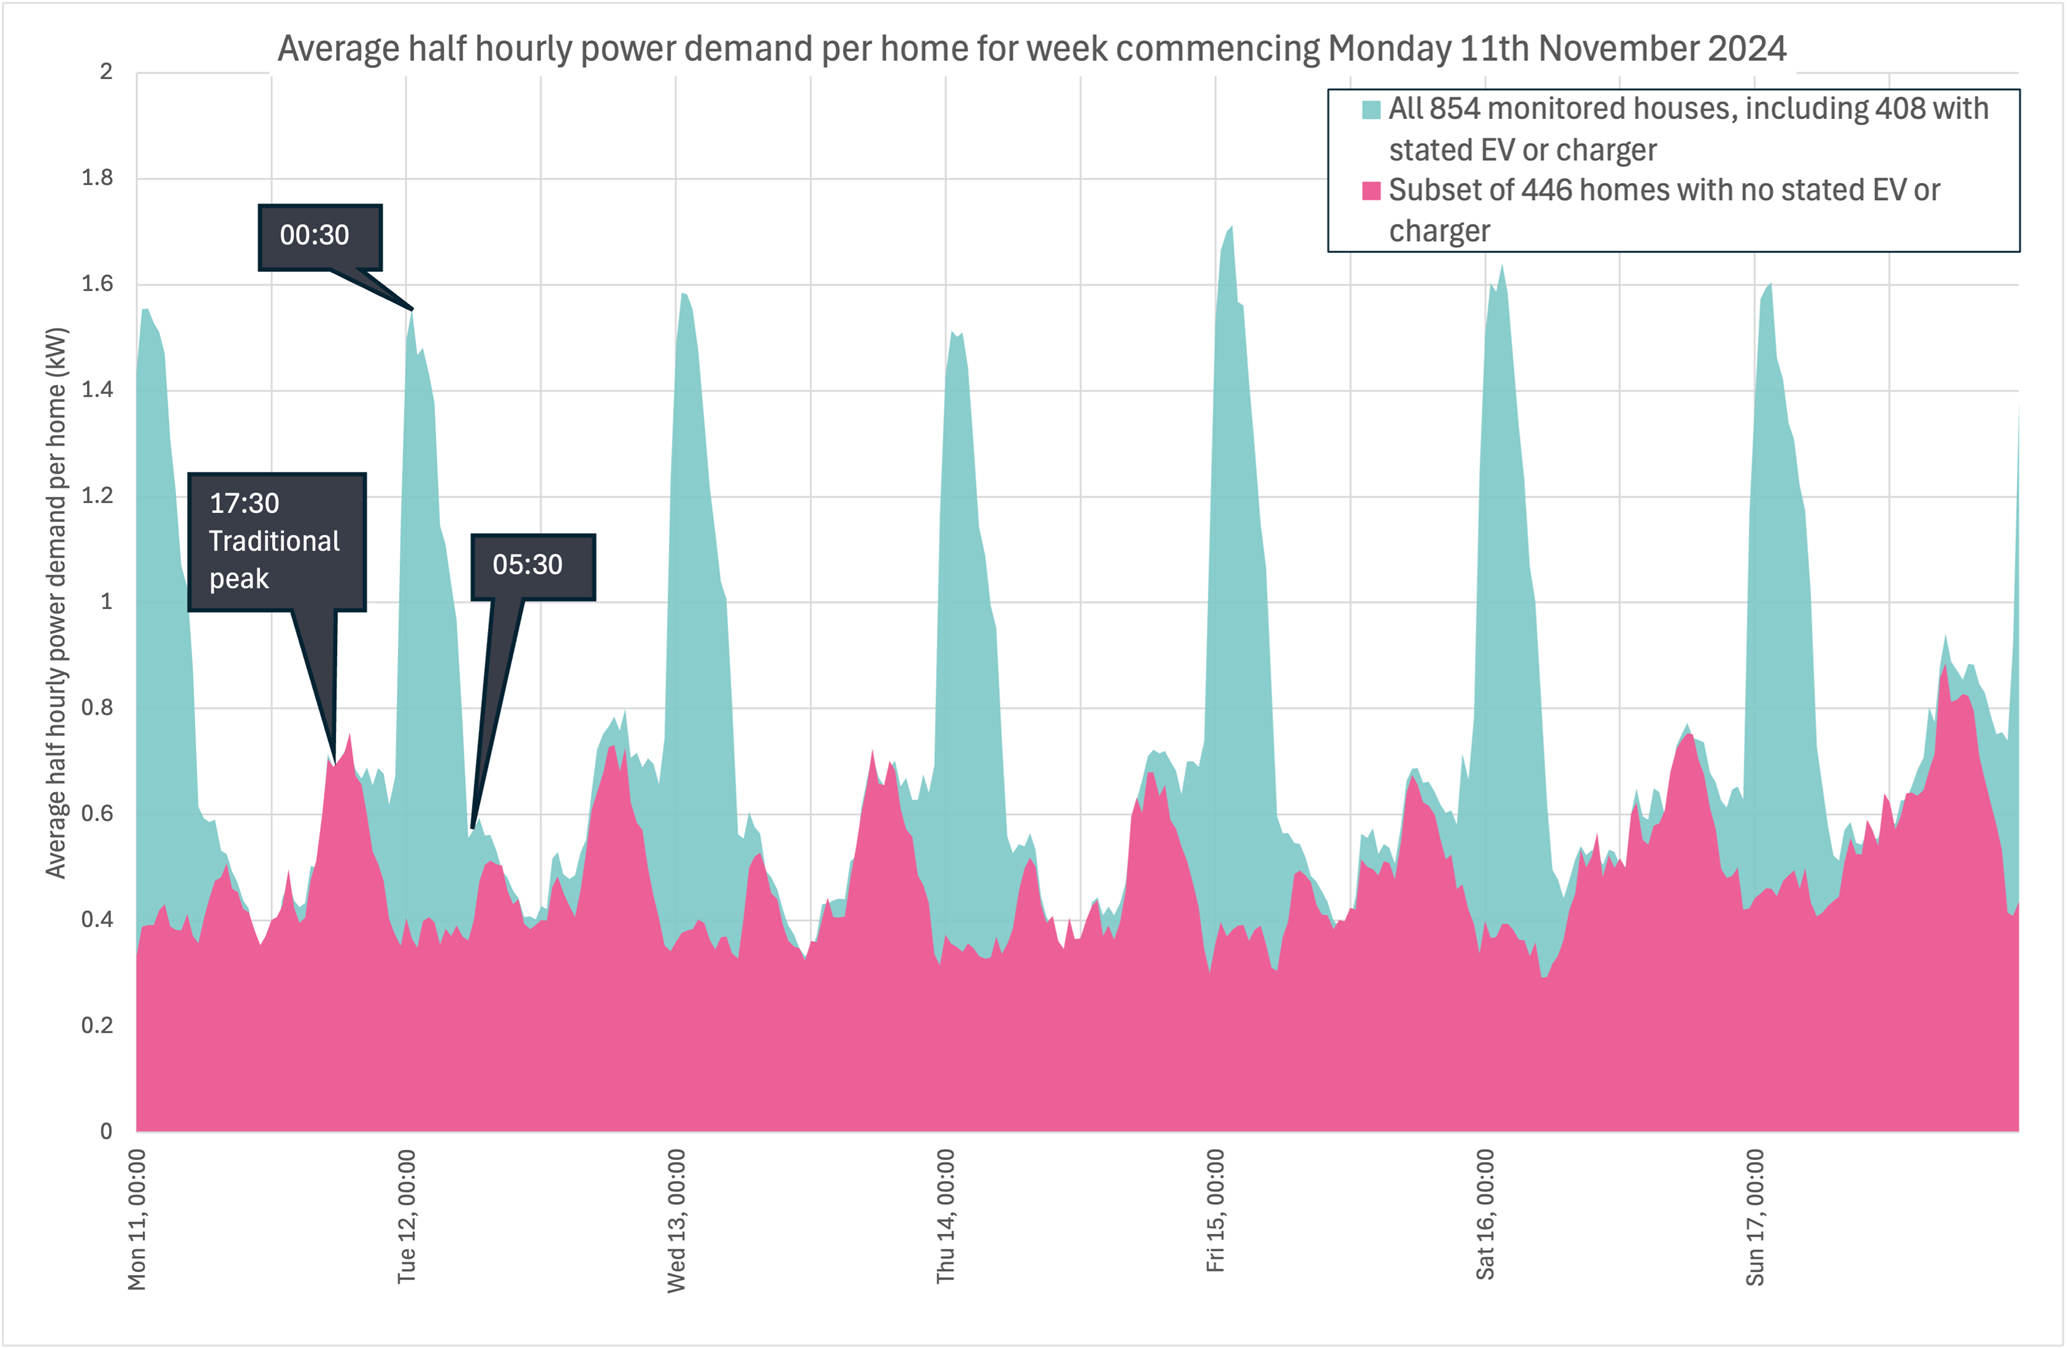
Electricity use rises sharply around 12:30am, when a popular cheaper overnight tariff begins. The overnight peak is bigger than the usual early-evening peak.
At current levels of EV ownership, this can work well: overnight charging makes use of periods when demand is generally lower. But our data is telling the industry that this approach may need to change as EV ownership rises. Once enough people are charging in the same window, that window becomes the new peak, and the very tariffs designed to flatten demand can end up creating new spikes.
What this might mean for you, eventually: the overnight tariffs that are useful today may need to evolve. We could see smarter tariffs that vary the cheap window from home to home, or respond to local grid conditions, so we don't all charge at the same time.
2. How heat pumps change winter
Cold weather gives us another glimpse of how electricity use is changing.
In November 2024, we compared two Thursdays one week apart. The average temperature across Great Britain fell from 8.7°C on the first day to 0.5°C on the second.
In homes with gas heating, the overall pattern of electricity use stayed fairly similar. People still cooked dinner, watched TV, and charged their phones at the same times.
In homes with a heat pump, the whole shape of the day changed. On the colder day, they used more electricity throughout the morning and afternoon. Even the lowest point around midday was almost three times as high as it had been the previous week. The heat pump was running for longer and working harder to keep homes warm.
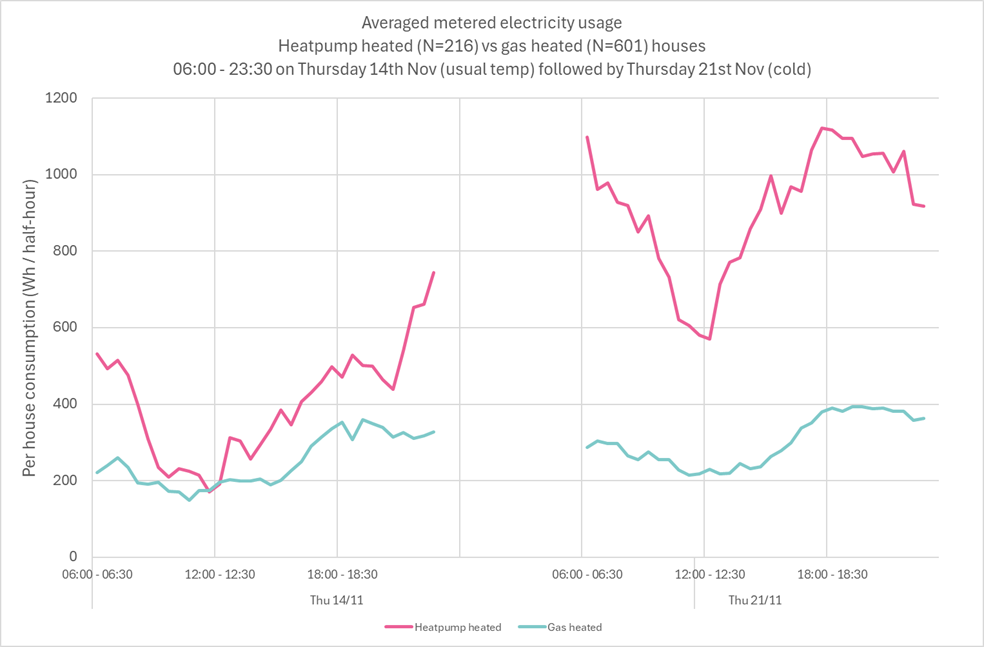
When the weather turned colder, electricity use in homes with heat pumps increased throughout the day. The pattern in gas-heated homes changed much less.
That matters because, as more homes switch to electric heating, cold weather will have a much bigger effect on electricity demand. Gas networks already have requirements to plan for periods of extreme cold. Electricity networks don’t currently have the same requirement for heating demand. That may need to change as electric heating becomes more widespread. The coldest days of the year will become increasingly important when planning how much electricity the system needs to deliver.
There's a positive flip side too. Separately, we've been looking at homes with optimised heat pumps: systems with smart controls that adjust based on the weather and the time of day. These homes are already shifting when they use electricity, with much less dramatic peaks that suggest pre-heating and hot-water cycles during cheaper periods. This suggests there is some flexibility in when heat pumps use power. This can help homes save on electricity, and also protect the grid from big spikes in demand which can cause problems.
What this might mean for you, eventually: if you've got a heat pump, or you're thinking about one, how it's set up and controlled matters. Smarter controls may be able to shift some electricity use to cheaper periods, while still keeping your home comfortable.
3. Low-carbon technologies often come together
National figures usually track each clean technology separately. They tell us how many homes have solar panels, how many have a heat pump, or how many have an EV. Living Lab data lets us look at how they appear together.
Of the Living Lab homes with at least one of these technologies, 53% have more than one. About 10% have what we call the full stack: an EV (and charger), solar panels, a battery, and a heat pump.
EV-only and solar-only homes are the most common single-technology groups, which may make them common entry points to home electrification. Financial incentives may also help explain why: tax incentives have supported EV uptake, while generating your own electricity can help reduce energy bills.
Most homes with batteries (96%) also have at least one other technology, and 89% of them have solar panels specifically, so batteries appear to be less common as a first technology. Most heat-pump homes have other low-carbon technologies too: 79% have at least one of the other three. Early heat-pump adopters therefore often appear to be households already using other low-carbon technologies.
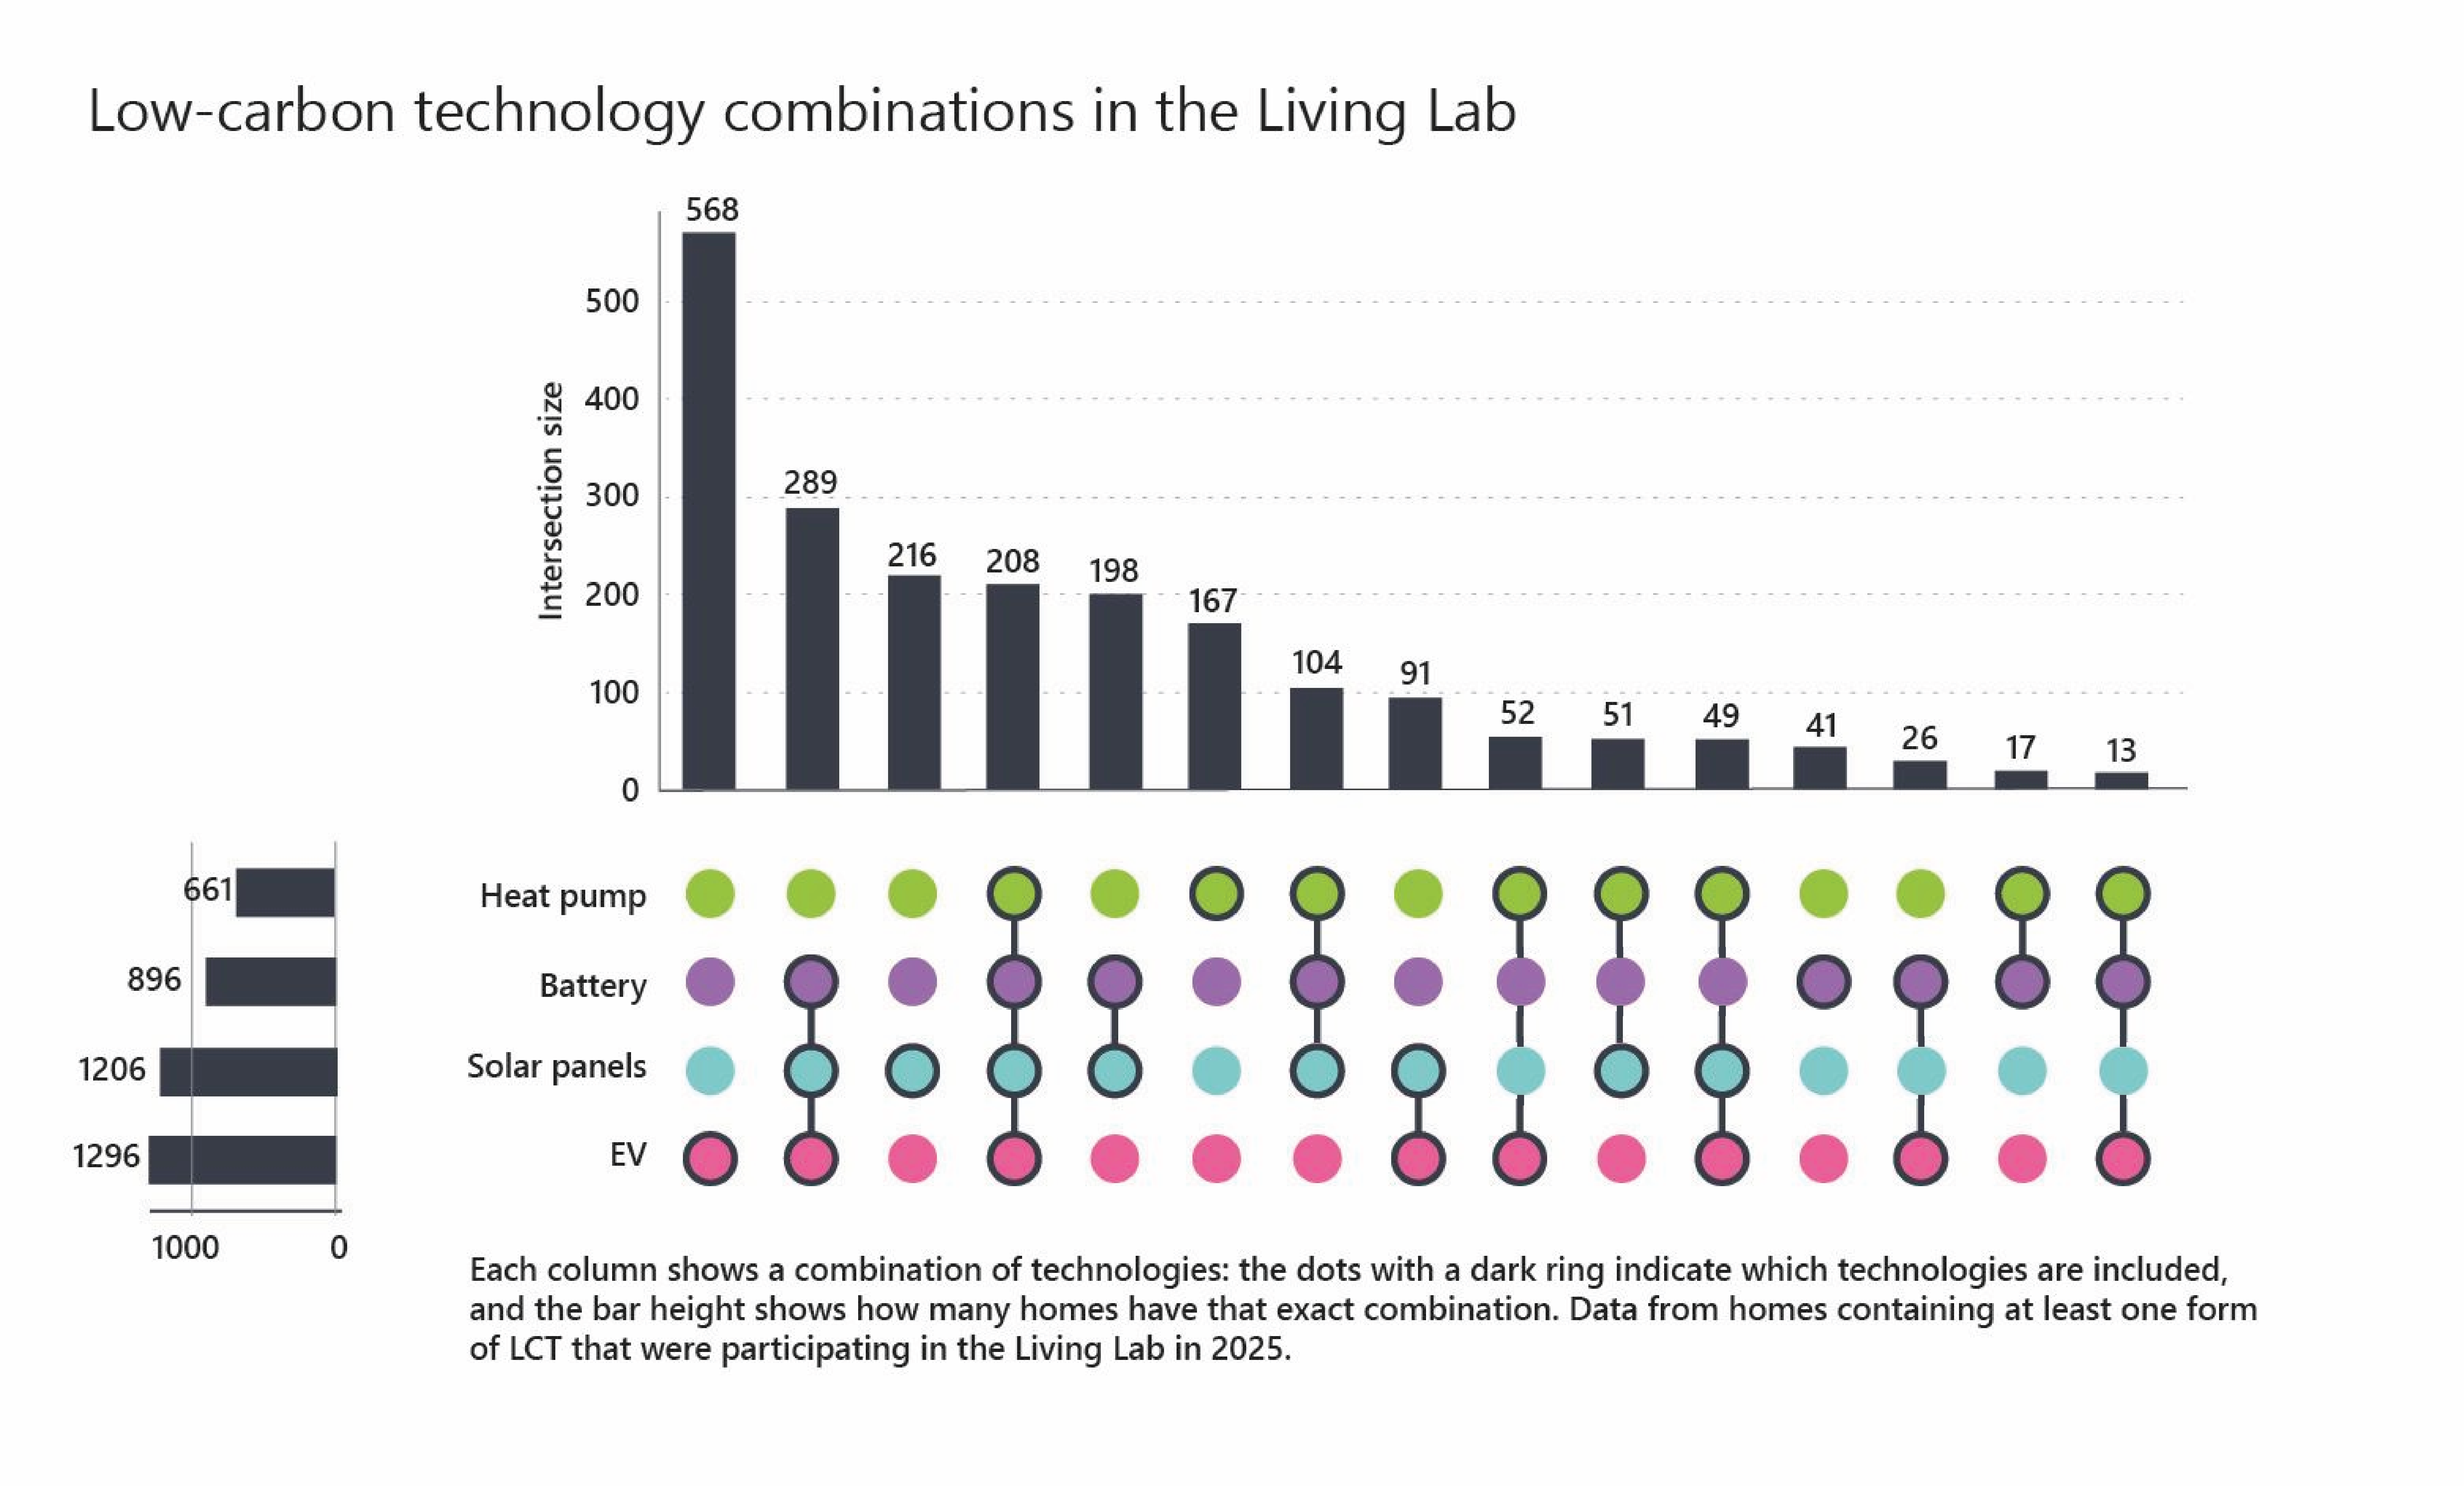
Although we can't see the order in which households added these technologies, the overall pattern suggests that home electrification isn't always a one-step decision. For some households, it may build up over time.
What this might mean for you, eventually: the way you interact with your home's energy could become more layered, and probably more automated. Tools that help you manage everything together, sometimes called home energy management systems, could become more useful and more common as more homes have several technologies to coordinate. Suppliers and installers could increasingly offer combined packages rather than selling each technology in isolation.
What this all tells us
These three findings have one thing in common: they come from what’s actually happening in people’s homes. That can reveal things that models alone can't. People don't always behave exactly as forecasters expect. Tariffs can change how and when we use electricity. Cold snaps affect electrically heated homes differently and can change things faster than averages suggest. Low-carbon technologies appear together in patterns that national statistics don't currently show.
Smart meter data on its own tells us what is happening at the meter. Knowing more about the home helps us understand why. Data from homes without low-carbon technologies helps us understand how people use energy today, while data from homes with these technologies helps us see how those patterns may change as more people adopt them.
Low-carbon technologies are much more common in Living Lab homes than across UK households overall. For EVs, solar panels, batteries and heat pumps, adoption rates in the Living Lab are roughly a decade ahead of national rates. That's part of the value. These homes can give us an early look at patterns that may become more common in the future. Homes without low-carbon technologies are just as valuable as part of the wider Living Lab, helping us understand a broader range of households and giving us an important point of comparison for the changes we’re seeing in homes with these technologies.
The energy system of the 2030s is being shaped by changes already happening in homes today. The more clearly we can see what's happening and the more accurately we can describe what we see, the better prepared the system can be for the changes ahead.
If you’re already a Living Labber, thank you. Insights like these are only possible because people choose to share information about their homes and energy use with us.
And if you’re not part of the Living Lab yet, you can find out more and join the Living Lab. By taking part, you can help us understand how energy works in real homes and help shape better products, services and energy systems.
If you’d like to explore the findings in more detail, our analysts have also written the more technical articles behind them:
- The emerging EV overnight demand peak
- Heat pumps and household energy use on the coldest days
- Grid impacts of heat pumps, EVs and solar revealed
- What can the Living Lab tell us about home energy technology adoption?
The future of home energy is already showing up in our data. We'll keep sharing what we find.
Share this article
Recent articles
Join the Living Lab today!
It only takes a few minutes. Help us make energy cleaner, simpler, and more affordable for everyone!
Need some help? Contact the Living Lab team